One of the most uncertain, intangible things you’ll deal with as an entrepreneur is your context, the world around you. Although everyone has insights and opinions, there are few ways to effectively have a discussion with others about what you think is important in the world around you or what will happen in the future. and, even if you’re able to have meaningful discussions about your contextual ideas, it’s just as difficult to share and track them. WhAT IF YOU COULD CHANGE THAT?
Mapping the world around you
The difficulty of sharing your perspective with others is that everyone else also has their own specific point of view with regards to the context. This means that it is also very difficult to revisit the ideas you had in the past in order to build on them. Moreover it becomes difficult to spot new trends if you’re always caught up arguing about “the now”. After all, what you see around you today is important. But, you’re not simply building for now. (Hopefully) you’re also building for the future.
What if there was a way not only to map out what you and your team think is important in your context, but also a way to track how your perspective changes over time, and a way to identify blind spots and actively look for them?
The context MAP® CANVAS
Visual meetings
David Sibbet’s book Visual Meetings on Amazon
The Context Map® Canvas is a way to do just that: It helps you visualize the world around your business with a team. It was developed by visual facilitation pioneer David Sibbet, founder of The Grove Consultants and author of Visual Meetings. This canvas addresses trends you see around you as well as political, technological and other influences. In Design A Better Business, we feature a number of David’s awesome tools. To tune it for use in a business environment, we added some new elements to the context canvas for Design A Better Business, such as your competition.
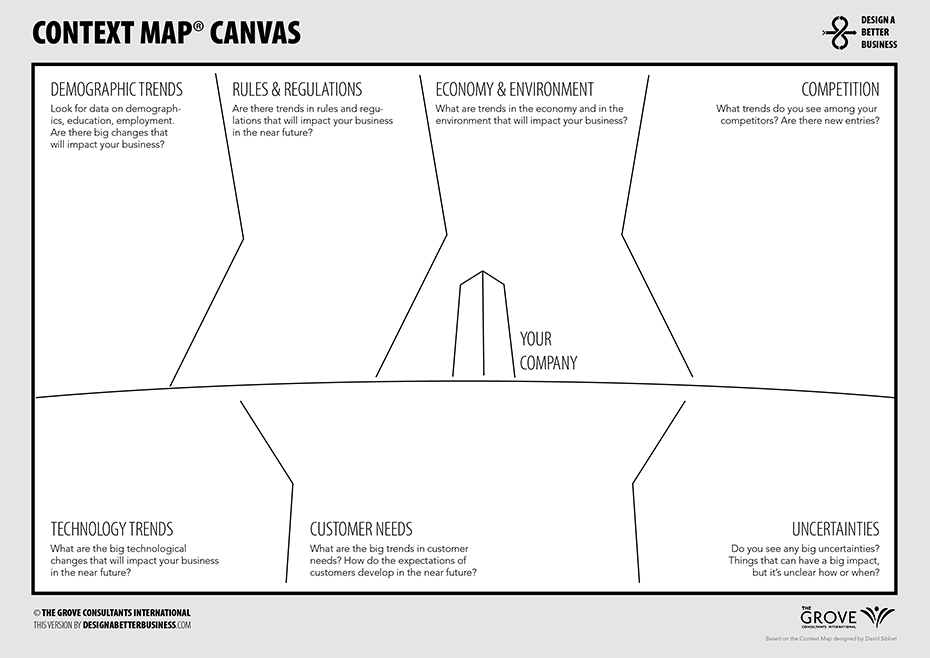
With the Context Map® Canvas, you can explore your context quickly, and build it up over time. Now you can share your context with your team and discuss what is really important, what you need to know more about, and what safe bets are
Revisiting this map every few months will give you a sense of the developments and longer term trends.
If you want to get started with the context canvas, simply print or draw a canvas on a big piece of paper, and use sticky notes and markers to make notes of the things you see around you. Look for information sources, such as newspapers, magazines, and online sources. When you have a good base, try to find some information that does not agree with what you know, or that comes from a source you normally wouldn’t consider. Get some team members together and ask for their opinions. Use this new insight to iterate on your map. Then do it again: the world will always change, so the map is never done.
Most importantly – besides doing this with your team: try to look at the context beyond your company and the industry it lives in. Sure, your company’s context is important. But, there is a great big world of contextual drivers out there beyond your company. Any one of these may present interesting challenges or opportunities for your company’s future.
How we hacked the context canvas: the world of…
Sharing the context with your team is one thing; sharing it with a large audience is quite another. How do you convince a large group of people that their context is changing? That their world will experience a dramatic shift?
Take the world of advertising for example. It is moving fast. Our client wanted to make the need to transition from dying traditional media to a “fresh future” clear for an audience of advertising firms. We wanted to visualize that transition in the form of a large image. That showed the transition and also as a way to support a story of change – both as a picture of the changing landscape of advertising and as an invitation for a conversation.
Sketch First
To create that image, we started by mapping the context first, identifying themes and important examples. We filled in a context map like the one above, with a lot of great information. We used that to validate our story with key members of the audience. But in and of itself, a sheet of paper filled with sticky notes did not tell the compelling story we were looking for. We needed more than that.
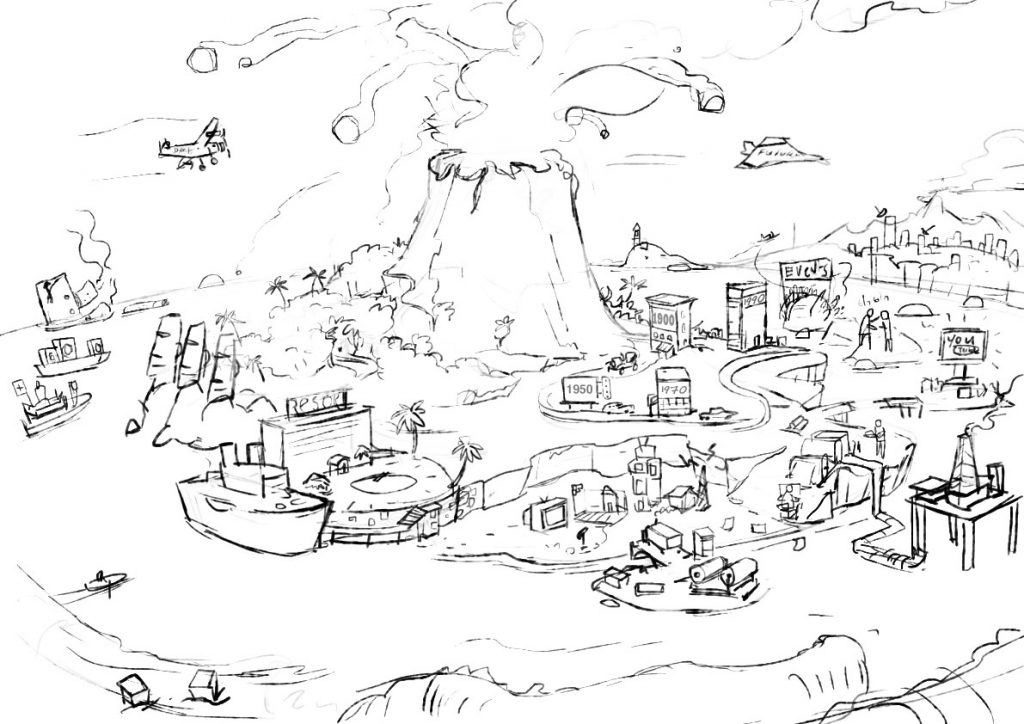
So, we started to explore metaphors to support the story as well as the subject matter. We settled on an island metaphor that would be subjected to a “tsunami of change”. We mapped out what the island, centered on a “dying volcano of creativity”, looked like. Where would we fit the examples? How might we put in some of the key figureheads in the back story? We also needed to fit a timeline of advertising on the map as well.
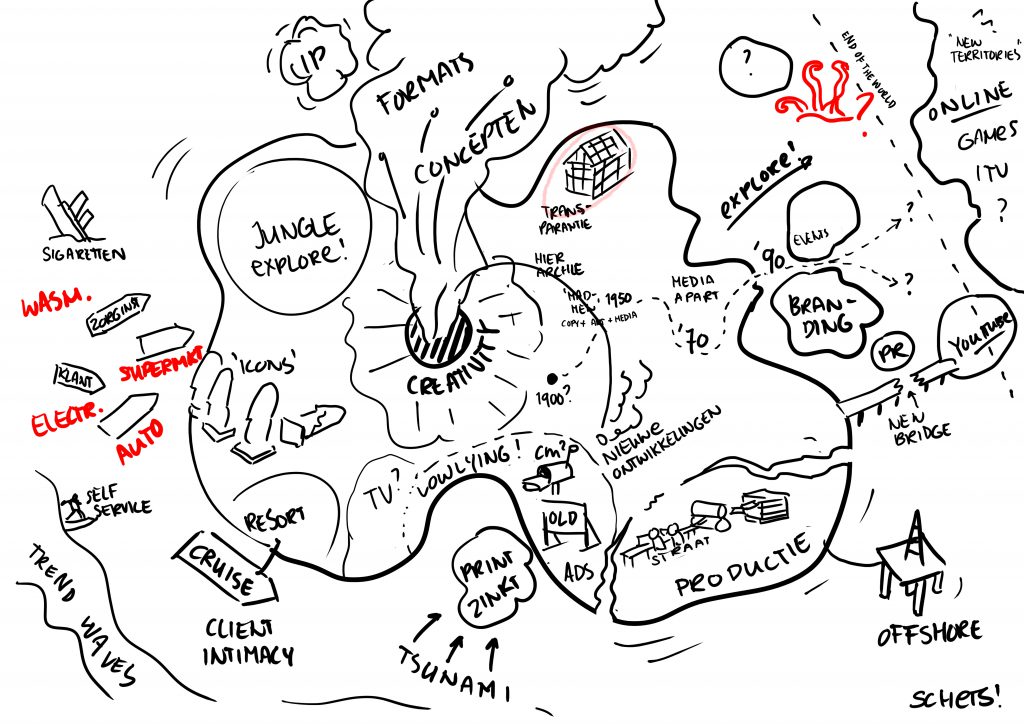
Next, we started sketching the view of the island, iterating it with the story. Notice that the first draft only shows the dying island – when we evaluated that, we found out that the story also needed a positive side – the “island of opportunity”.
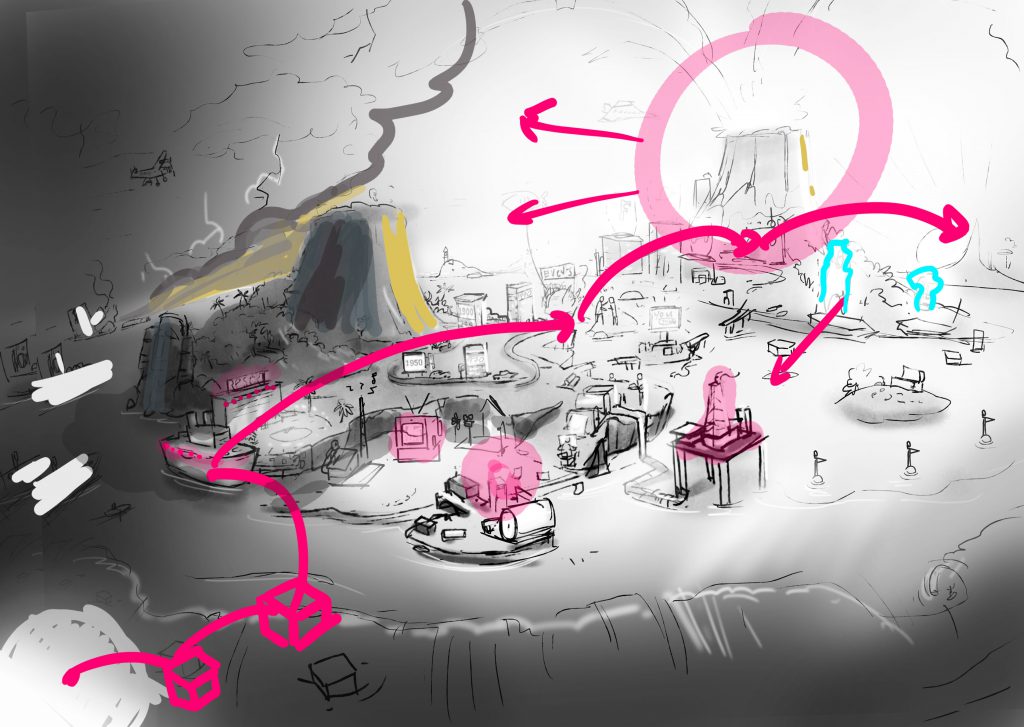
The next iteration shows both islands, with the intended visual flow in the image from the dark, left side to the bright, positive right side. The active volcano of opportunity is both dangerous and change-inflicting and a bringer of light in this picture. To make the edits as clear as possible we drew comments right on top of the picture – crude, but effective.
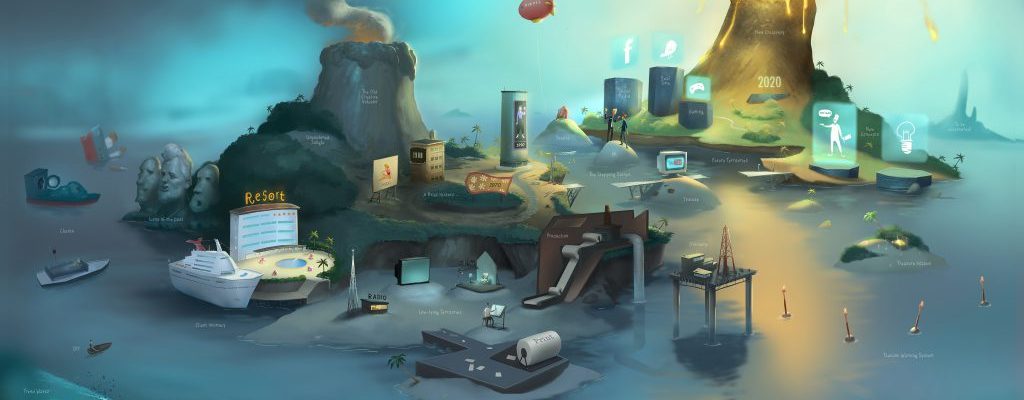
Then, the final version was made, making a beautiful, detailed image that can be printed as a poster to be hung on a wall. We wanted to make it look really cool and went for a large format painting style. The brings the message across to an audience from advertising, who needed high quality visuals to relate to the story.
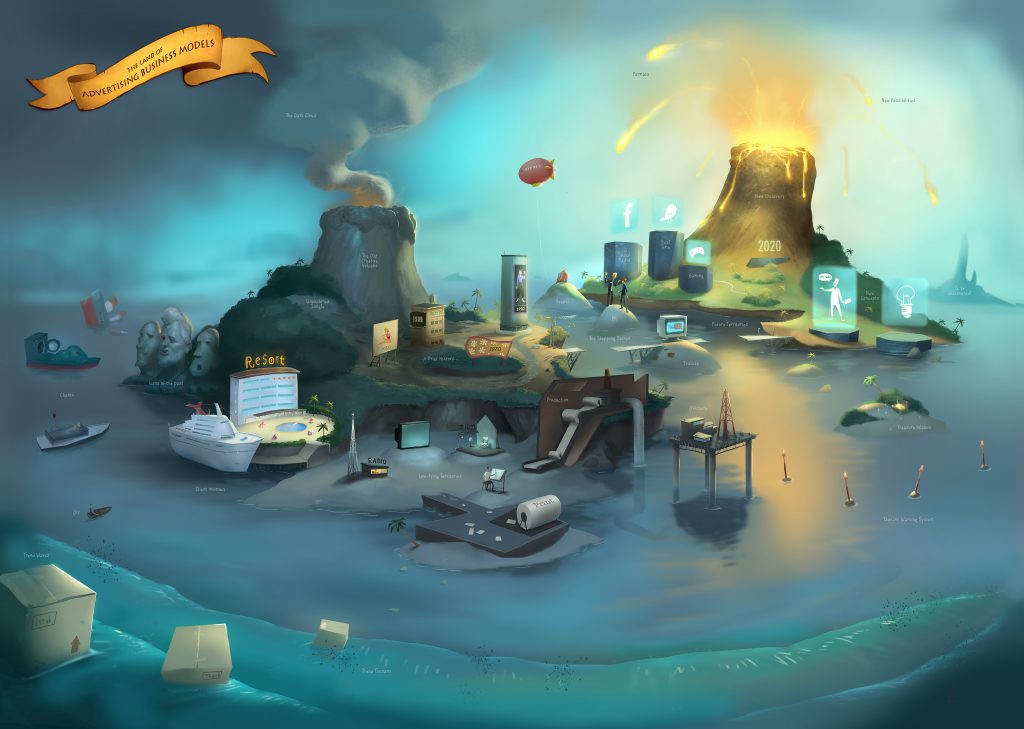
The final result, printed in full, is an image that invites a conversation and allows the story to start from any point. It has enough detail to keep coming back to it. In the book, you will find more examples of “the world of” visuals.
Beyond the context canvas: scenario planning and the hype cycle
If you want to go even further there are two techniques to dig into: scenario planning and the hype cycle graphic.
SCENARIO PLANNING
Background on Scenario Planning on Wikipedia
Scenario planning is a technique that will enable your team to explore different possible futures and create strategic options to effectively deal with these futures. By tracking specific metrics, it also allows you to figure out which of these futures is actually becoming reality over time. You can make different versions of your context map, extrapolating it into the future. Look for extreme developments of trends and stand back to see what that looks like. Reality will probably play out somewhere between these extremes.
The Technology Hype Cycle
Background of the Hype Cycle on Wikipedia
The Hype Cycle was developed by Gartner and is a visual representation of future developments. Use it for technological developments. Upcoming developments are tracked with estimates of the time they will need before they reach maturity versus the amount of “hype” they attract. Developments go through a pattern. First they have a peak of hype, while the technology is still immature, followed by disillusionment. Only after that initial peak and trough will the technology slowly grow towards maturity. You can use this to plot different trends and their impacts from your context map.